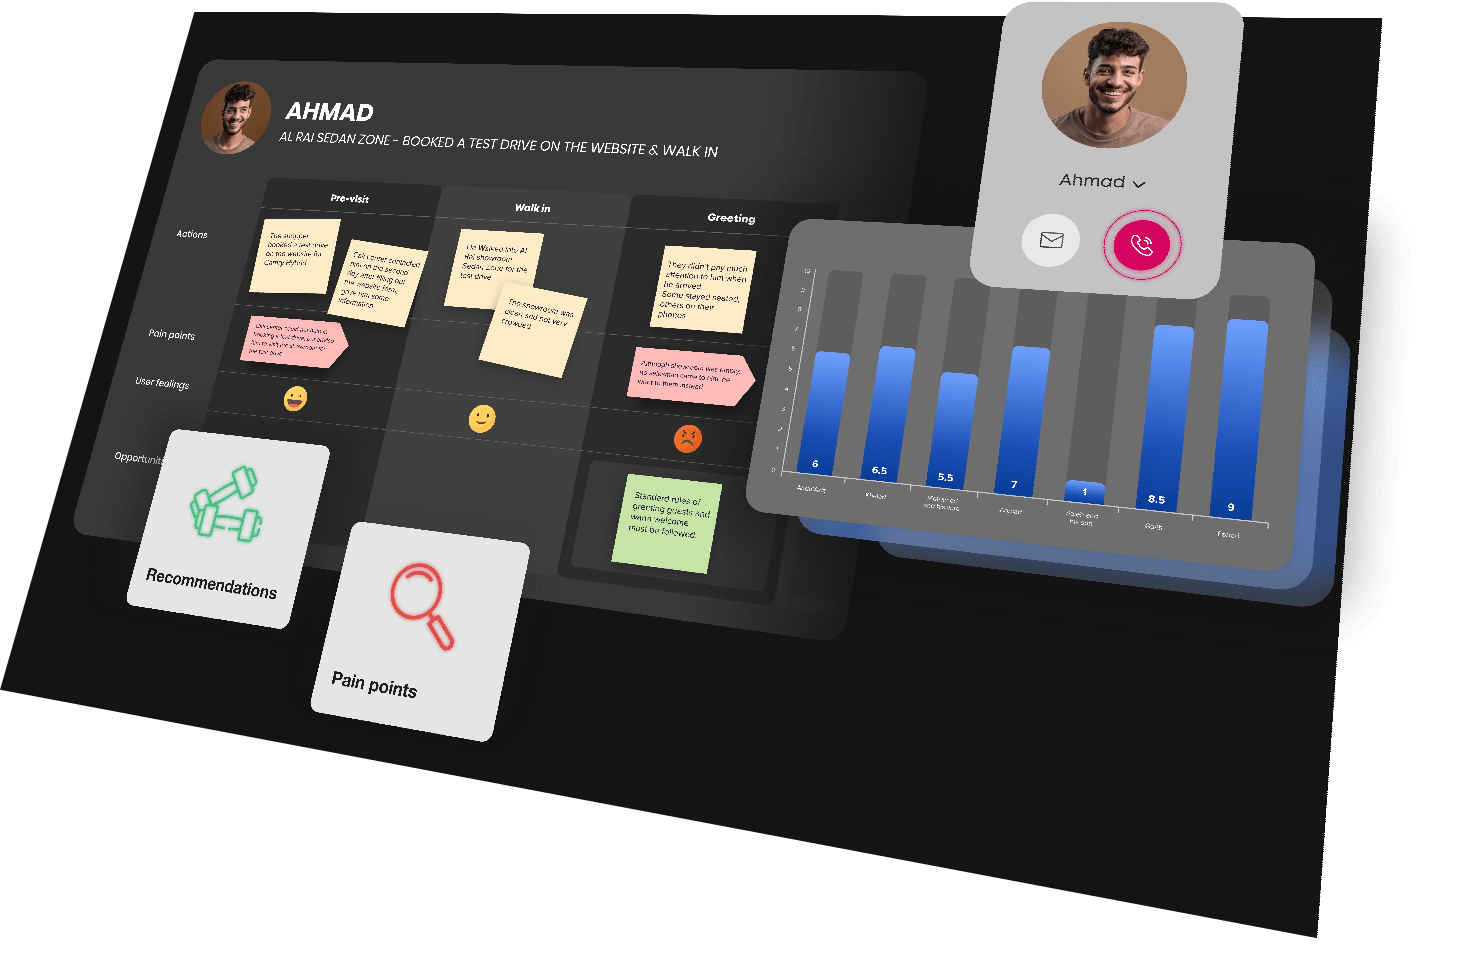
A user journey map allows businesses to identify touch points and interactions where users may encounter challenges or unmet needs. Through this user-centric approach, businesses can align their UX/UI design and strategy with the user’s goals, thereby enhancing overall satisfaction and engagement.
Journey Map is used in UX design and CX strategy
Overview
How do journey maps help businesses succeed?

At Mindflares
We map out an entire experience by showing the steps and emotions
By visualizing the user’s experience, we highlight untapped innovation and differentiation opportunities, helping businesses create unique value propositions and stand out from competitors. Moreover, we remove any bottlenecks or friction points in the user experience that can negatively affect the user experience.

How is a user journey developed?
Research and Analysis
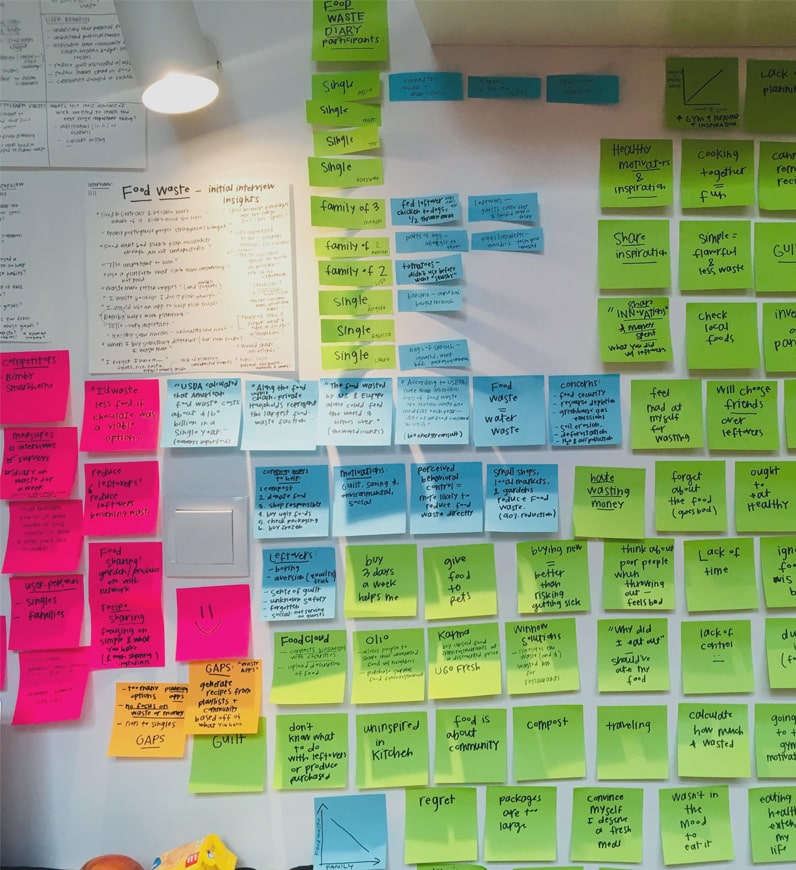
Data is collected qualitatively and quantitatively through methods such as user interviews, surveys, and market research. By analyzing the data, we gain insights into users’ preferences and behaviors.
Touch-points Map
Sketch out the sequence of touchpoints users encounter both online and offline (websites, mobile apps, social media, physical stores, customer service, etc.).
Define
We outline the actions and emotions experienced by users at each touchpoint. This step helps us to empathize with users and understand their journey from their perspective.
Identify Opportunities
Upon completion of all visits and post-interviews, a report is developed evaluating the experience according to defined metrics.
Deliverables
- Customer Journey Maps/Visual representations depicting the different stages and touchpoints of the customer's experience.
- Research Findings and Insights Reports summarizing qualitative and quantitative research findings identifying pain points, preferences, and opportunities for enhancing the customer journey.
- Recommendations and Action Plans for Improving the customer experience. These can include process improvements, technology enhancements, training, communication strategies, or design changes.

“Listen to your customers, not your competitors.”
— Joel Spolsky —
Founder of Stack Overflow, Trello, HASH
