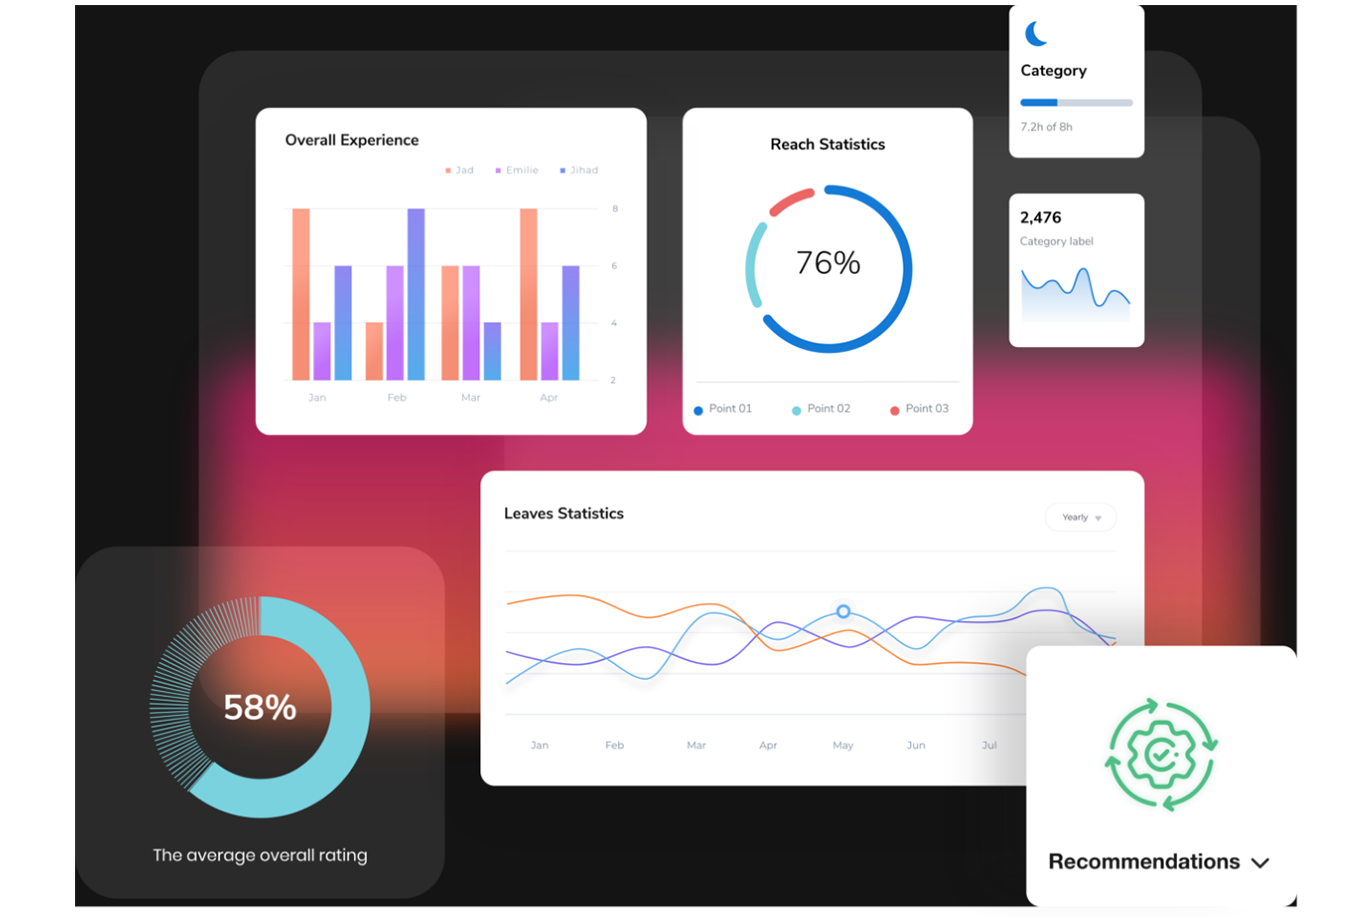
By leveraging data and analytics in today’s competitive environment, organizations can gain deeper insights, identify growth opportunities, and anticipate customer needs. This will enable them to optimize their performance and develop innovative products and services which set them apart from their competitors.
Overview
How can businesses optimize their performance with data?

At Mindflares
We’ve helped many clients improve their operations with data reporting
Transforming valuable data into actionable insights empowers decision-makers to improve business performance, identify significant patterns, and implement vital strategies. This comprehensive approach leads to enhanced performance, increased customer satisfaction, and maximized profitability.

What is the process of Data Analysis?
Data Collection
We collect data from a variety of sources, such as databases, surveys, customer support data, analytical tools, third-party data, and others, once we have defined our objectives.
Data Cleaning
The data is cleaned and prepared to be transformed into structured data, which can be analyzed according to the insights desired.
Data Analysis
The insights and patterns are extracted using a variety of techniques. It includes both descriptive and inferential analysis.
Data Reporting
Following the analysis, the findings are interpreted so that they can be effectively communicated to stakeholders. The results are also transformed into actionable insights that can help to motivate positive change in the organization.
Deliverables
- Reports and Presentations providing a comprehensive summary of the analysis process and methodologies, which can be shared with stakeholders or decision-makers.
- Visualizations and Dashboards that make complex information easily understandable by using charts, graphs, and interactive dashboards to represent the results of the data analysis.
- Recommendations and Actionable Strategies based on the analysis findings, guiding stakeholders on specific actions to be taken for improved performance, addressing challenges, or leveraging opportunities identified by the analysis.

“Data is the new oil, requiring refinement through analytics to fuel success!”
— Bernard Marr —
Founder and CEO of Bernard Marr & Co
